
What’s happening to property prices to date?
Even though we are continually hearing about house prices changing, contrary to media reports, there has been very little movement to national average property prices over the past couple of years, as the chart and analysis shows.
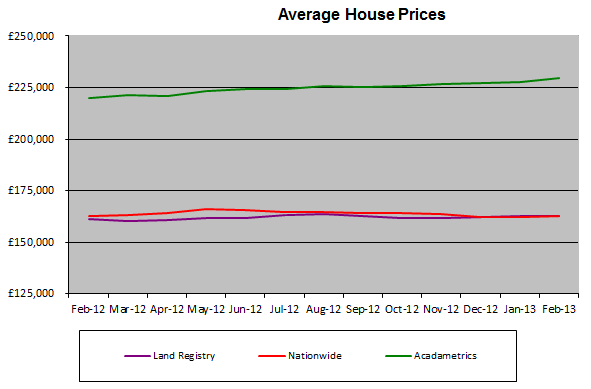
Chart showing Average Property Prices February 2012 to February 2013 in England and Wales
Key facts about average property prices in England and Wales from February 2012 to February 2013:-
National Averages
- An ‘average property’ price for mortgaged properties has fluctuated between £162k – £166k for Nationwide
- Average property prices, including cash sales, by the Land Registry varied slightly between £160k and £163k
- Average property prices for all properties from Acadametrics shows a range between £220k and £229k
- Property prices in February, on average, are approximately:-
- 7.4% above the lows of 2009 for Land Registry
- 11.4% above the lows of 2009 for Nationwide
- 14.8% above the lows of 2009 for Acadametrics
- Land Registry average property prices February 2013 versus January 2011 have only changed by -0.3%
- Nationwide average property prices February 2013 versus January 2011 have only changed by 0.6%
- Acadametrics average property prices February 2013 versus January 2011 have only changed by 3.3%
View the detailed property price report here, which includes:-
- Regional and national averages
- What’s happening in the towns and cities?
- What’s happening to prices currently?
- Will 2013 prove a turning point in the property market?
What to do next? For more help, from Kate and her team, join Property Checklists for free.
Buying your first home Trading up Buy to Let Renting a Property Selling a Property For Industry Professionals If you are you a property professional or journalist who needs up to date, accurate, facts and figures, stats about residential property, subscribe to our Property Information Portal.

Pingback: Previous Property Price Reports | Kate Faulkner BSc (Econ) MBA DipM CIM